Understanding your Dyno Graph
One of the key components of any Electronic Control Unit (ECU) remapping operation to boost a vehicle’s engine power and overall performance is the ‘dyno graph’ – an electronic readout which, according to its curves and numbers, tells us much about what has been happening during the remapping process.
For those who haven’t had it done, a remap is carried out by modifying a car’s ECU – its onboard computer. The ECU has default settings that, for various reasons, limit a car’s performance, and these settings can be overwritten to enhance that performance.
Among many other benefits, an ECU remap will give your engine more power output and torque, improving acceleration and throttle response. You won’t need to change gear as regularly and your fuel efficiency will improve.

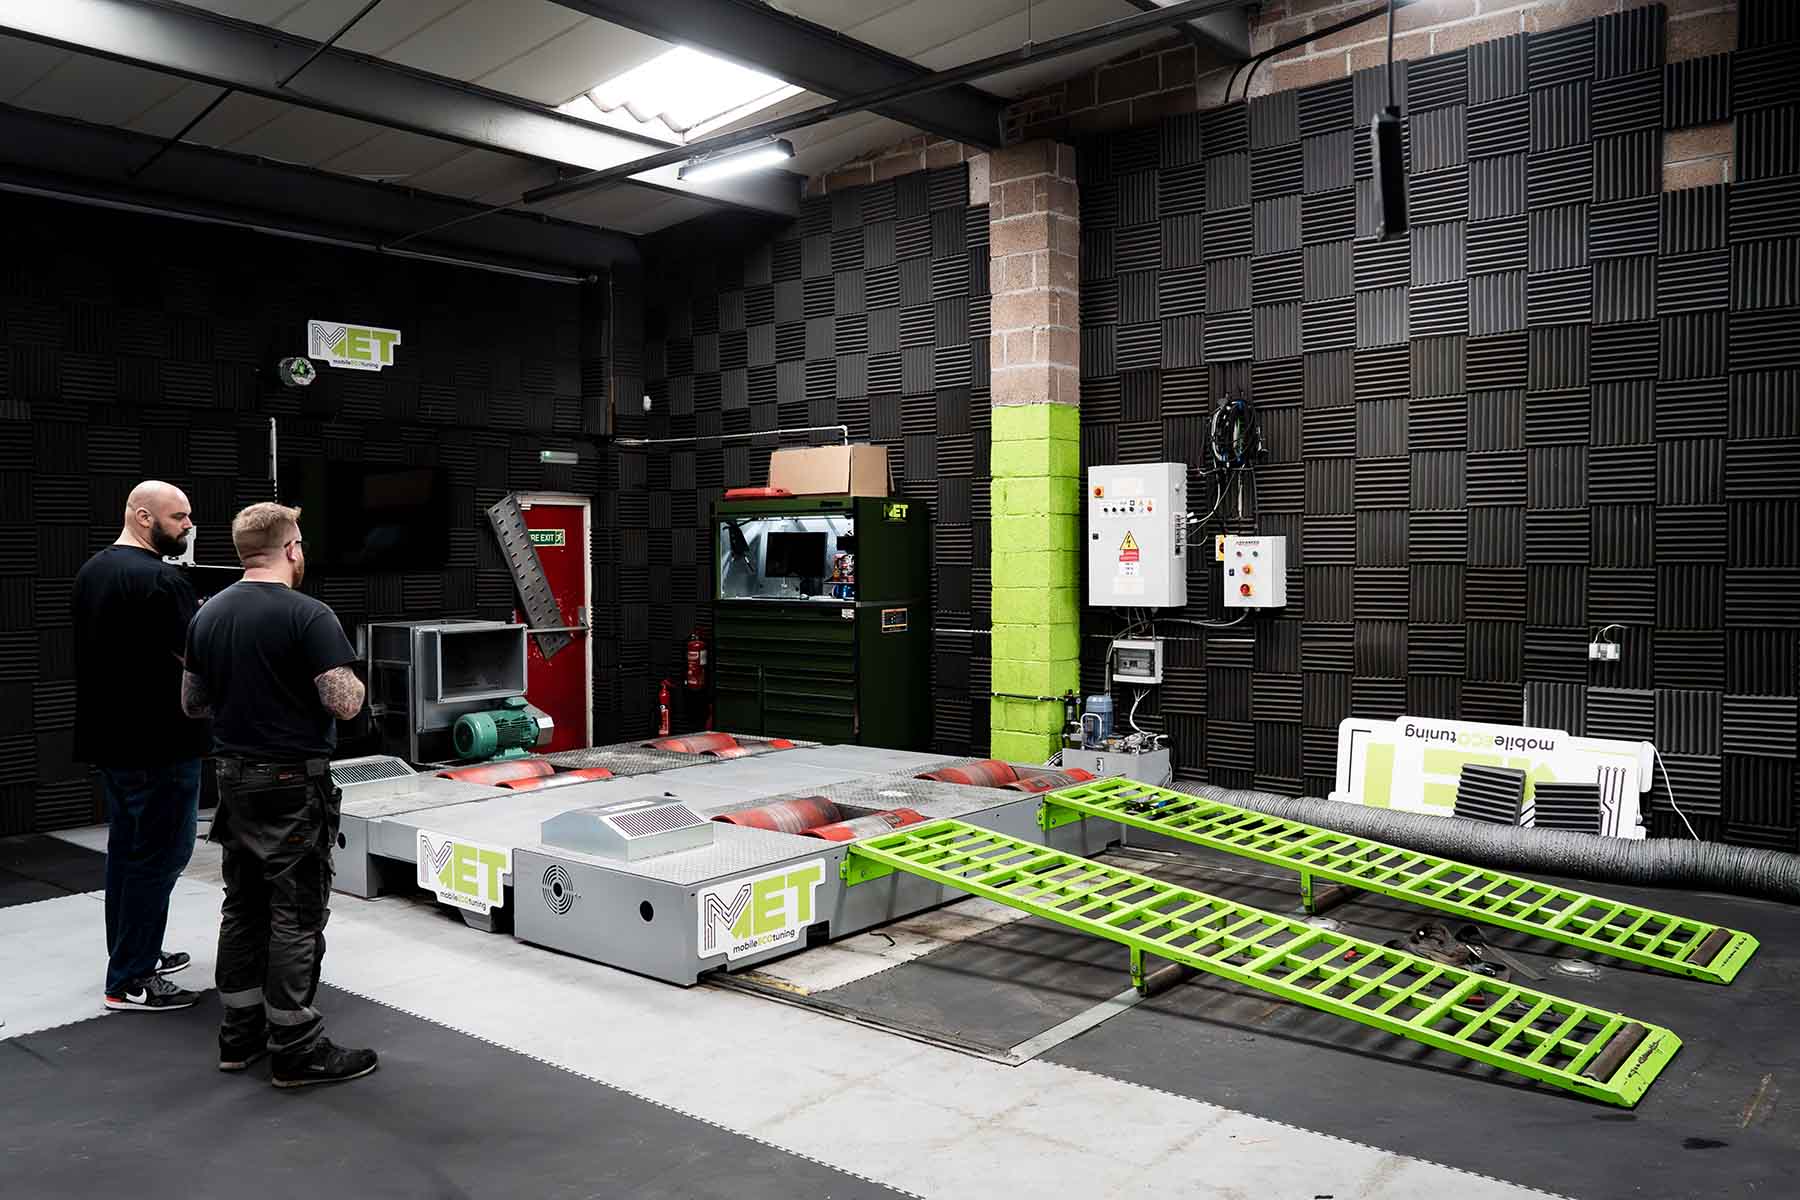
The dyno chart or graph is a visual display of what has been going on while your car has been on our ‘rolling road’ – a machine designed to simulate different road conditions that is the equivalent of a fitness treadmill for cars.
Basically, this graph will show the vehicle’s power and torque through the full rev range at full throttle. It will also show a before and after comparison graph so that you can see how your car will perform as it accelerates through a gear.
There are certain ways that technicians read the different measurements on these graphs to ascertain overall performance, and these are useful to know if you as the customer want to make sense of the readout. So let’s look at a few of these:
- Torque curve. The graph depicting this should be reasonably smooth with no significant dips and no waviness, as this might indicate irregular boost control.
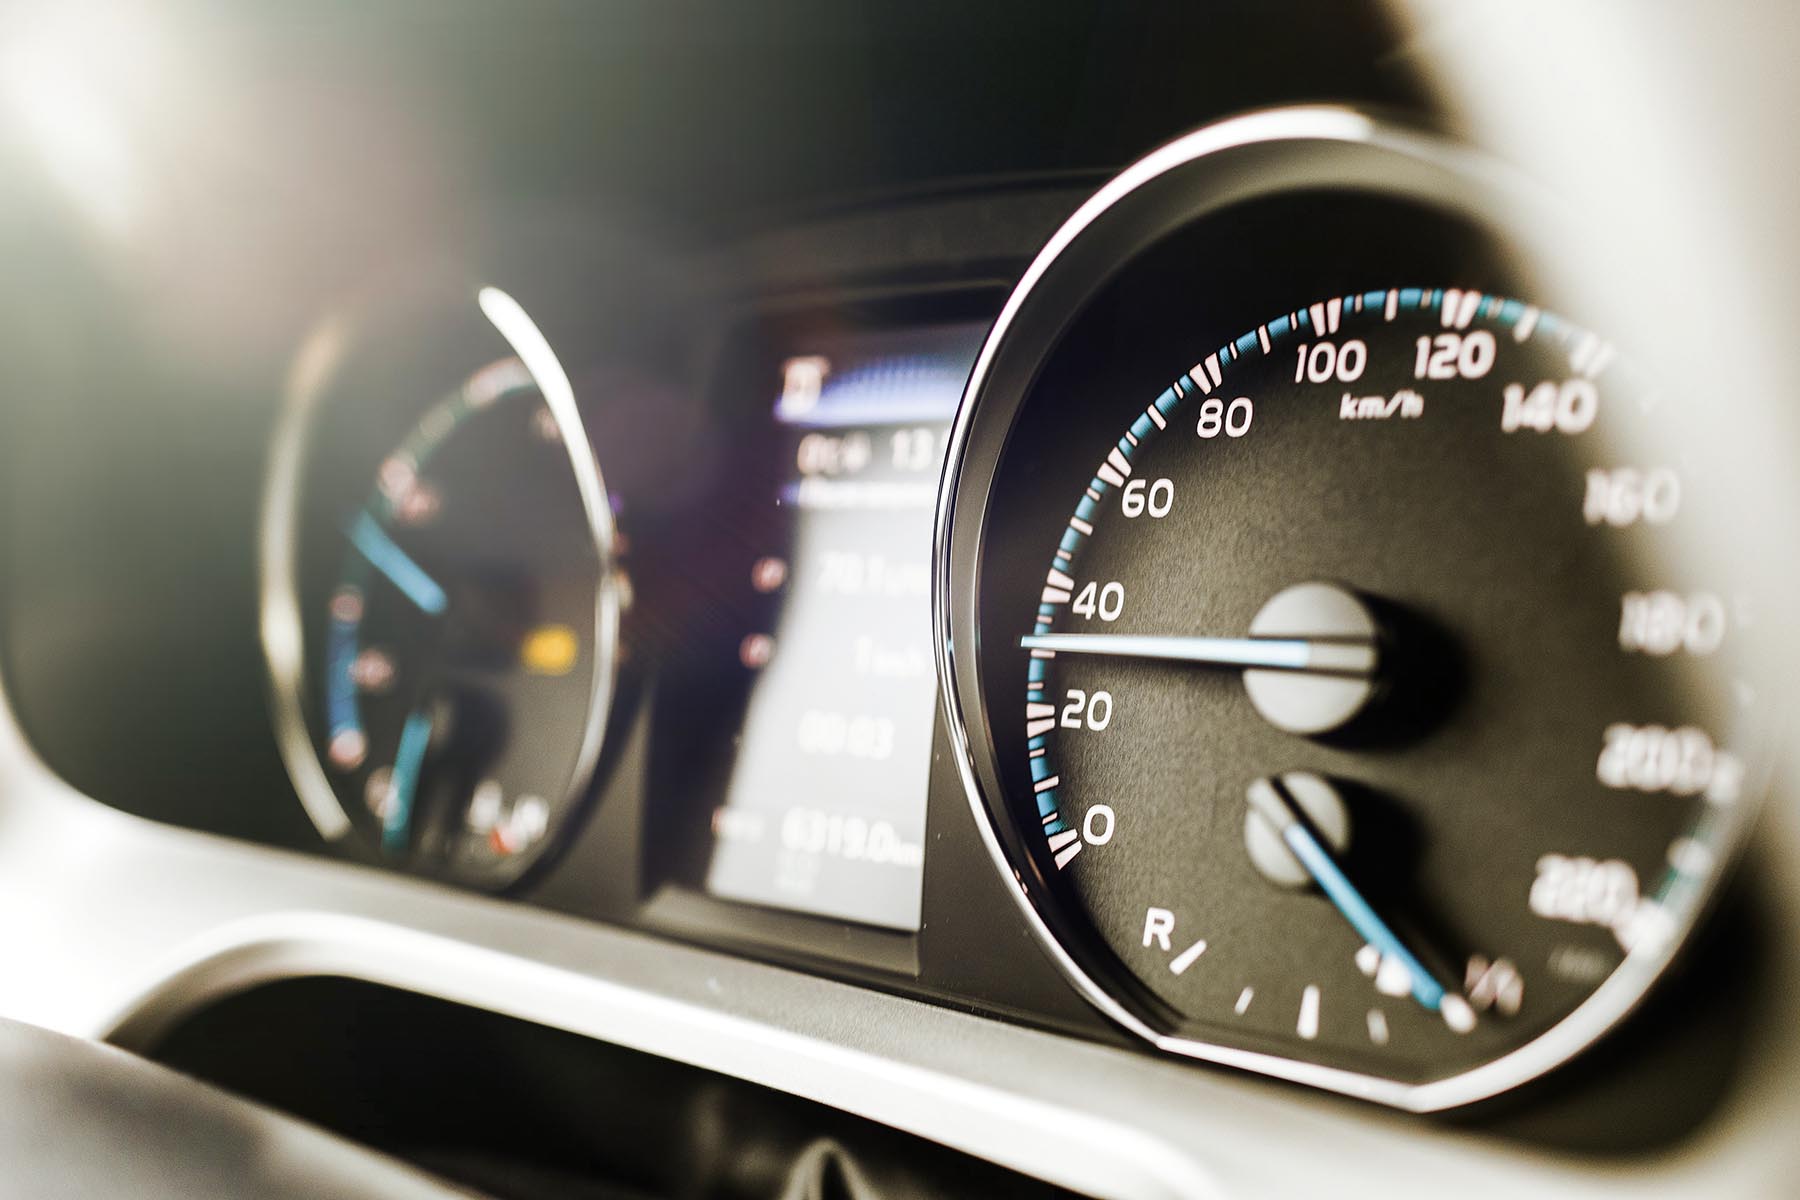
- Engine speed. By looking at the engine speed where peak torque and peak power occur, you can see what the drive is delivering. Torque that peaks early and steeply indicates fast spooling, while a softer climb demonstrates a smoother delivery. The torque that peaks later suggests the car has some lag and will require more revs for the turbo to produce full boost.
- Torque and power spread. A broad torque and power band tends to equal a highly drivable car with plenty performance if the graph is reasonably smooth. Also, the further the distance in engine speed between peak torque and peak power, the more drivable the car will be.

A dyno graph is an important part of the remapping process, and it does give a good indication of a car’s performance before and after the modification work. However, it’s important to say that it’s parameters are not infallible and, like all data, can be prone to error or misinterpretation. For example, a 2.0 turbocharged engine and a 5.0 naturally aspirated V8 might have a similar dyno graph. Out on the road, though, and there is likely to be a very different story. If you accelerate hard the V8 will produce instant torque with a very sharp throttle response, whereas the 2.0 turbocharged engine will take time to build boost. Also, some cars that drive very well can struggle to produce a good dyno graph because the test causes boost control to behave in a way it never will on the road.
Here at Mobile Eco Tuning we’re always happy to talk about and answer questions about our dyno graphs. We do our best to make them as accurate as we possibly can, as we know that our customers are keen to both see and experience their car’s renewed performance. For more information about dyno graphs and dyno tuning, give us a shout by calling 01934 644427 or contacting us here. We can chat through your requirements for your car, offering helpful and friendly advice wherever we can.